Chapter 3 Extension
3.1 Moderating the effect by country: the influence of austerity
As outlined by Jeannet (2018, 6), economic factors might influence the association between being retired and the attitude towards immigration. In particular, austerity measures, as enforced after the Euro-Crisis in various EU member states, might moderate the association between retirement and the attitude towards immigration. Austerity measures go along with pension cuts, lower wages and shrunk welfare states. This could lead to higher competition in the labor market and thereby have a moderating effect on the association between labor market competition and the attitude towards immigration. To assess this potential effect, I build a statistical model which uses the country variable as a moderator of the association between retirement and the attitude towards immigration. By comparing Spain and Portugal as two countries (see Perez and Matsaganis (2018, 192)), where austerity measures were implemented to Northern-, and Central-European countries, where austerity measures were not implemented, a first indicator for a difference between the two groups can be identified.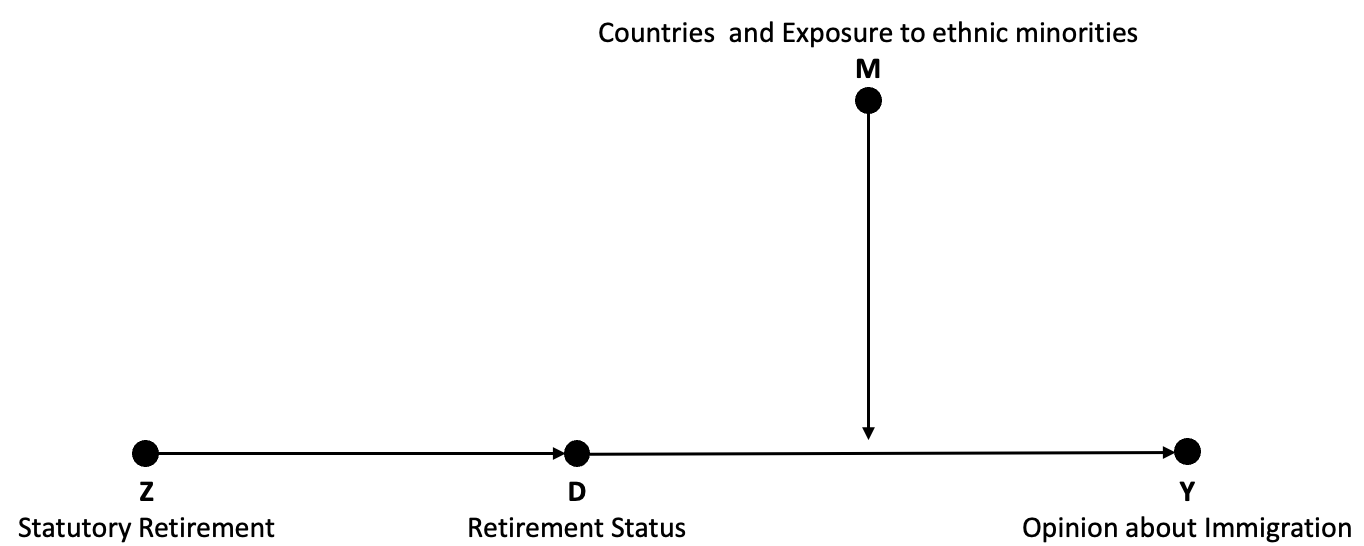
Figure 3.1: Directed Acyclical Graph for the two moderation models
| Country | Economy | Jobs | Taxes.and.Services |
|---|---|---|---|
| Austria | -0,895908* | 0.206606 | -0,325906 |
| Belgium | 0,161745* | -0.303896 | -0,231181 |
| Dennmark | -0,253997 | 0.120927 | -0,027896 |
| Finland | -0,215704 | -0.062116 | 0,143372 |
| France | -0,537427 | -0.536226 | -0,559469 |
| Germany | -0,0518* | -0.062942 | -0,193864 |
| Ireland | -0,261491 | 0.162328 | 0,822104** |
| Netherlands | 0,43583** | 0.227705 | -0,006322 |
| Norway | -0,236883 | -0.006707 | 0,033519 |
| Portugal | 0,46901** | 0.612596 | -0,318325 |
| Spain | 0,227779* | 0.271073 | 0,575255 |
| Sweden | 0,695344*** | 0.377887 | 0,347663 |
| Switzerland | -0,343478 | -0.086776 | -0,408697 |
| United Kingdom | 0,011656* | -0.135252 | 0,014154 |
| Note: | |||
| Coefficients are calculated from the corresponding instrumental variable regression outputs. |
The table below shows the regression output used to calculate the effects in table 3.1. This model also includes the control variables used in the previous models.
| Economy | Jobs | Taxes & Services | |
|---|---|---|---|
| Austria/ Baseline |
-0.896 * (0.370) |
0.207 (0.362) |
-0.326 (0.358) |
| Retired * Belgium |
1.058 * (0.457) |
-0.511 (0.443) |
0.095 (0.448) |
| Retired * Denmark |
0.642 (0.492) |
-0.086 (0.450) |
0.298 (0.464) |
| Retired * Finland |
0.680 (0.426) |
-0.269 (0.410) |
0.469 (0.419) |
| Retired * France |
0.358 (0.444) |
-0.743 (0.434) |
-0.234 (0.437) |
| Retired * Germany |
0.844 * (0.411) |
-0.270 (0.402) |
0.132 (0.397) |
| Retired * Ireland |
0.634 (0.497) |
-0.044 (0.471) |
1.148 * (0.476) |
| Retired * Netherlands |
1.332 ** (0.426) |
0.021 (0.410) |
0.320 (0.415) |
| Retired * Norway |
0.659 (0.462) |
-0.213 (0.445) |
0.359 (0.451) |
| Retired * Portugal |
1.365 * (0.574) |
0.406 (0.556) |
0.008 (0.535) |
| Retired * Spain |
1.124 * (0.539) |
0.064 (0.571) |
0.901 (0.513) |
| Retired * Sweden |
1.591 ** (0.500) |
0.171 (0.440) |
0.674 (0.470) |
| Retired * Switzerland |
0.552 (0.447) |
-0.293 (0.438) |
-0.083 (0.460) |
| Retired * United Kingdom |
0.908 * (0.460) |
-0.342 (0.447) |
0.340 (0.449) |
| Observations | 3616 | 3607 | 3598 |
| R2 / R2 adjusted | 0.168 / 0.157 | 0.131 / 0.120 | 0.104 / 0.093 |
|
|||
3.2 Exposure to ethnic minorities and the attitude towards immigration
Beyond mere economic explanations (ergo-, and socio-tropic), the exposure towards ethnic minorities might have a substantial effect on the association between being retired and the attitude towards immigration (see Kehrberg (2007)). The European Social Survey (2014) includes a variable that queries, whether people of minority race/ ethnic group currently live in the are of the respondent. The relevant categories for this analysis are: “Almost nobody minority race/ ethnic group”, “Some minority race/ ethnic group”, and “Many minority race/ ethnic group”. I use this variable as an indicator for exposure to ethnic minorities. Being retired on average:- increases the perception that immigration is good for the economy by .014 for people who are exposed to almost no ethnic minorities,
- decreases the perception that immigration is good for the economy by .17 for people who are exposed to some ethnic minorities, and
- decreases the perception that immigration is good for the economy by .12 for people who are exposed to many ethnic minorities.
| Exposure | Economy | Jobs | Taxes |
|---|---|---|---|
| 1 Almost nobody | 0.014295 | -0.2076727 | 0.014295 |
| 2 Some | -0.183881 | 0.1495856 | -0.183881 |
| 3 Many | -0.144058 | 0.0245160 | -0.144058 |
| Note: | |||
| Coefficients are calculated from the corresponding instrumental variable regression outputs. |
In conclusion, I can oberserve variation in the association between the retirement status and the attitude towards immigration moderating for different countries and their austerity status as well as the exposure to ethnic minorities. However, the sub-effects are only partially significant. The moderation models provide a more differentiated view on the association in question and can - on a more granular level - confirm the hypothesis, that the labor market hypothesis in the given sample cannot be confirmed. The moderation do however show, that the effect substantially varies between mixed market economies, which implemented austerity measures and coordinated market economies in Central Europe. This difference challenges the ahistorical, apolitical and micro-sociological perspective by Jeannet (2018). Firstly, attitudes towards migration are a result of the colonial history of a state and are therefore not ahisorical. The data confirms the notion that individuals from former colonizer nations tend to have a substantial shift in attitude towards immigration after retirement compared to other states (see United Kingdom, Netherlands, Portugal, and Spain). Secondly, the association between retirement status and the attitude towards immigration is by definition a political matter and cannot be confined to the economic status of an individual or the entire economy of a country. Rather, the values of an individual might substantially contribute towards its attitude towards immigration. Therefore, future research shall assess, whether economic or value-driven factors are key determinants of attitudes towards immigration.
| Economy | Jobs | Taxes & Services | |
|---|---|---|---|
| Almost nobody/ Baseline |
-0.184 (0.147) |
-0.208 (0.141) |
0.014 (0.141) |
| Some |
-0.114 (0.166) |
0.150 (0.157) |
-0.184 (0.160) |
| Many |
0.299 (0.299) |
0.025 (0.290) |
-0.144 (0.284) |
| Observations | 3616 | 3607 | 3598 |
| R2 / R2 adjusted | 0.132 / 0.126 | 0.074 / 0.068 | 0.075 / 0.068 |
|
|||
RMD files
In case you want to reproduce the analysis, the code can be downloaded here: https://frp.vwinterhager.de/rmd_files/RMD_Files.zip
References
Allaire, JJ, Yihui Xie, Jonathan McPherson, Javier Luraschi, Kevin Ushey, Aron Atkins, Hadley Wickham, Joe Cheng, Winston Chang, and Richard Iannone. 2020. Rmarkdown: Dynamic Documents for R. https://github.com/rstudio/rmarkdown.
European Social Survey. 2014. “ESS Round 7: European Social Survey Round 7 Data.” Research & Politics Data file edition 2.2.
Henry, Lionel, and Hadley Wickham. 2020. Purrr: Functional Programming Tools. https://CRAN.R-project.org/package=purrr.
Jeannet, Anne-Marie. 2018. “Revisiting the Labor Market Competition Hypothesis in a Comparative Perspective: Does Retirement Affect Opinion About Immigration?” Research & Politics 5 (3): 2053168018784503.
Kehrberg, Jason E. 2007. “Public Opinion on Immigration in Western Europe: Economics, Tolerance, and Exposure.” Comparative European Politics 5 (3): 264–81.
Müller, Kirill, and Hadley Wickham. 2021. Tibble: Simple Data Frames. https://CRAN.R-project.org/package=tibble.
Perez, Sofia A, and Manos Matsaganis. 2018. “The Political Economy of Austerity in Southern Europe.” New Political Economy 23 (2): 192–207.
R Core Team. 2020. R: A Language and Environment for Statistical Computing. Vienna, Austria: R Foundation for Statistical Computing. https://www.R-project.org/.
Wickham, Hadley. 2016. Ggplot2: Elegant Graphics for Data Analysis. Springer-Verlag New York. https://ggplot2.tidyverse.org.
———. 2019a. Stringr: Simple, Consistent Wrappers for Common String Operations. https://CRAN.R-project.org/package=stringr.
———. 2019b. Tidyverse: Easily Install and Load the Tidyverse. https://CRAN.R-project.org/package=tidyverse.
———. 2020. Tidyr: Tidy Messy Data. https://CRAN.R-project.org/package=tidyr.
———. 2021. Forcats: Tools for Working with Categorical Variables (Factors). https://CRAN.R-project.org/package=forcats.
Wickham, Hadley, Mara Averick, Jennifer Bryan, Winston Chang, Lucy D’Agostino McGowan, Romain François, Garrett Grolemund, et al. 2019. “Welcome to the tidyverse.” Journal of Open Source Software 4 (43): 1686. https://doi.org/10.21105/joss.01686.
Wickham, Hadley, Winston Chang, Lionel Henry, Thomas Lin Pedersen, Kohske Takahashi, Claus Wilke, Kara Woo, Hiroaki Yutani, and Dewey Dunnington. 2020. Ggplot2: Create Elegant Data Visualisations Using the Grammar of Graphics. https://CRAN.R-project.org/package=ggplot2.
Wickham, Hadley, Romain François, Lionel Henry, and Kirill Müller. 2021a. Dplyr: A Grammar of Data Manipulation. https://CRAN.R-project.org/package=dplyr.
———. 2021b. Dplyr: A Grammar of Data Manipulation. https://CRAN.R-project.org/package=dplyr.
Wickham, Hadley, and Jim Hester. 2020. Readr: Read Rectangular Text Data. https://CRAN.R-project.org/package=readr.
Xie, Yihui. 2014. “Knitr: A Comprehensive Tool for Reproducible Research in R.” In Implementing Reproducible Computational Research, edited by Victoria Stodden, Friedrich Leisch, and Roger D. Peng. Chapman; Hall/CRC. http://www.crcpress.com/product/isbn/9781466561595.
———. 2015. Dynamic Documents with R and Knitr. 2nd ed. Boca Raton, Florida: Chapman; Hall/CRC. https://yihui.org/knitr/.
———. 2016. Bookdown: Authoring Books and Technical Documents with R Markdown. Boca Raton, Florida: Chapman; Hall/CRC. https://bookdown.org/yihui/bookdown.
———. 2021a. Bookdown: Authoring Books and Technical Documents with R Markdown. https://CRAN.R-project.org/package=bookdown.
———. 2021b. Knitr: A General-Purpose Package for Dynamic Report Generation in R. https://yihui.org/knitr/.
Xie, Yihui, J. J. Allaire, and Garrett Grolemund. 2018. R Markdown: The Definitive Guide. Boca Raton, Florida: Chapman; Hall/CRC. https://bookdown.org/yihui/rmarkdown.
Xie, Yihui, Christophe Dervieux, and Emily Riederer. 2020. R Markdown Cookbook. Boca Raton, Florida: Chapman; Hall/CRC. https://bookdown.org/yihui/rmarkdown-cookbook.